R
R is a powerful, open-source programming language and software environment created for statistical analysis, data manipulation, graphics, and reproducible research.
How to Customize Standard R Environment?
Section titled “How to Customize Standard R Environment?”Currently the standard R environment allow users to install extra packages by CRAN repository
To create custom environment, run below command in the SSH terminal (CLI), for tutorial in accessing CLI, please refer to SSH Shell Access to EdUHK HPC Platform and Cluster (Web-based Shell Access)
# Load R Environment Module$ module load R/4.3
# Start R CLI$ R
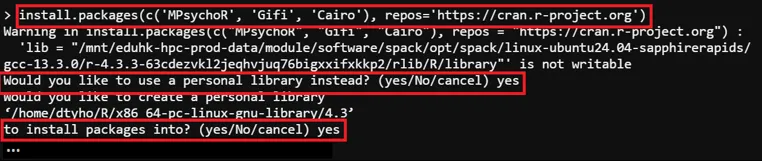
# Install Packages, All new packages will be located in /home/$USER/R> install.packages(c('<packages to install>'), repos='<repository_url>')
# Install Package (Example)> install.packages(c('MPsychoR', 'Gifi', 'Cairo'), repos='https://cran.r-project.org')
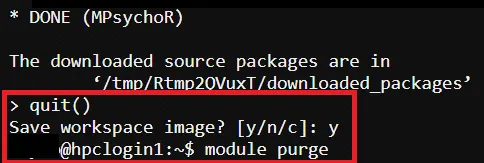
# Exit R CLI> quit()
# Purge Module$ module purge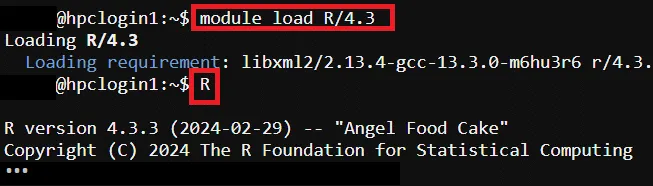
All new installed extra package will be located in /home/$USER/R/
How to Reset Customized R Environment as Default?
Section titled “How to Reset Customized R Environment as Default?”To reset the customized standard R environment as default, run the command below in the SSH terminal (CLI), for tutorial in accessing CLI, please refer to SSH Shell Access to EdUHK HPC Platform and Cluster (Web-based Shell Access)
# Reset User’s R Environment$ rm -rf /home/$USER/RHow to Create Customized R Environment by Anaconda?
Section titled “How to Create Customized R Environment by Anaconda?”To create custom R environment by Anaconda, please refer to How to Create Customized Environment by Anaconda?
How to Remove Customized R Environment (Anaconda)?
Section titled “How to Remove Customized R Environment (Anaconda)?”To remove custom R environment by Anaconda, please refer to How to Remove Customized Environment (Anaconda)?
R Program Source Code (Example)
Section titled “R Program Source Code (Example)”Example source code path → /home/$USER/job_template/R/MPsychoR_test.R
# Load librarieslibrary(MPsychoR)library(Gifi)library(Cairo)# Load the built-in datasetdata("zareki")
# Extract subtraction items (columns containing "subtr")zarsub <- zareki[, grep("subtr", colnames(zareki))]
# Perform nonlinear principal component analysisprinzar <- princals(zarsub)
# ---------------------------------------------------------# 1. Export the loadings plot to PNG using Cairo# ---------------------------------------------------------CairoPNG(filename = "zareki_subtraction_loadings.png",    width = 800, height = 600, dpi = 150, bg = "white")
plot(prinzar, main = "Zareki Subtraction Items Loadings Plot")
dev.off()
cat("Loadings plot saved as 'zareki_subtraction_loadings.png'\n in folder:", getwd(), "\n")
# ---------------------------------------------------------# 2. Export the text results (summary) as a PNG# ---------------------------------------------------------# Capture the printed outputoutput_text <- capture.output(print(prinzar))
CairoPNG(filename = "zareki_subtraction_results.png",    width = 1000, height = 1400, dpi = 150, bg = "white")
# Create an empty plot and add textplot.new()par(mar = c(2, 2, 3, 2))  # Small marginstitle(main = "Princals Results: Zareki Subtraction Items",  cex.main = 1.6, font.main = 2)
# Render the captured text on the canvastext(x = 0.02, y = 0.98,  labels = paste(output_text, collapse = "\n"),  adj = c(0, 1),   # Left- and top-aligned  cex = 0.85,      # Text size (adjust if needed)  family = "mono") # Monospace font for clean alignment
dev.off()
cat("Text results saved as 'zareki_subtraction_results.png'\n in folder:", getwd(), "\n")
For more information about R, please refer to: R Official Site